
Home
Account setting
Staff
Lists
Forms
Templates (HTML emails/SMS messages)
Sending messages by SMS and email
Classes, events, attendance and Zoom
Automation
Create a birthday invitation and automation
Communication
Microsite
E-Commerce
Networks, Federations and Franchises
How to guides
Personal information and electronic message laws in Canada and the USA
Get support
Terms and conditions
RL-24
https://activitymessenger.com/
10410 Waverly, Montréal, H3L 2W4
Terms and conditions

Bookings reports
Bookings reports help you understand how resources are scheduled, what clients were billed for bookings, when recurring busy periods occur, and how booking carts changed during a day. Use this guide to choose among Bookings, Bookings revenue, Traffic and Live bookings.
# Before you begin
Your organization must use the Bookings module. Owners and administrators can access all four reports. Accountants can access Bookings revenue but not Bookings, Traffic or Live bookings. Attendants can see Live bookings when they have access to the financial-reports page. The reports actually shown always depend on the signed-in user’s role and permissions.
Dates and times use the organization’s timezone. Bookings, Bookings revenue and Traffic require at least one selected resource before they return data.
# Open a Bookings report
- In the administration menu, open E-Commerce.
- Select Reports.
- Select the current report name to open the report menu.
- Under Bookings, select Bookings, Bookings revenue, Live bookings or Traffic.
- Select the date range and apply the report-specific filters.
- Use Save or share to preserve a URL with the current dates and supported filters.
# Bookings: scheduled use and resource utilization
Use Bookings when the question is how much selected resources were scheduled, which booking types used them, or how activity changed by day.
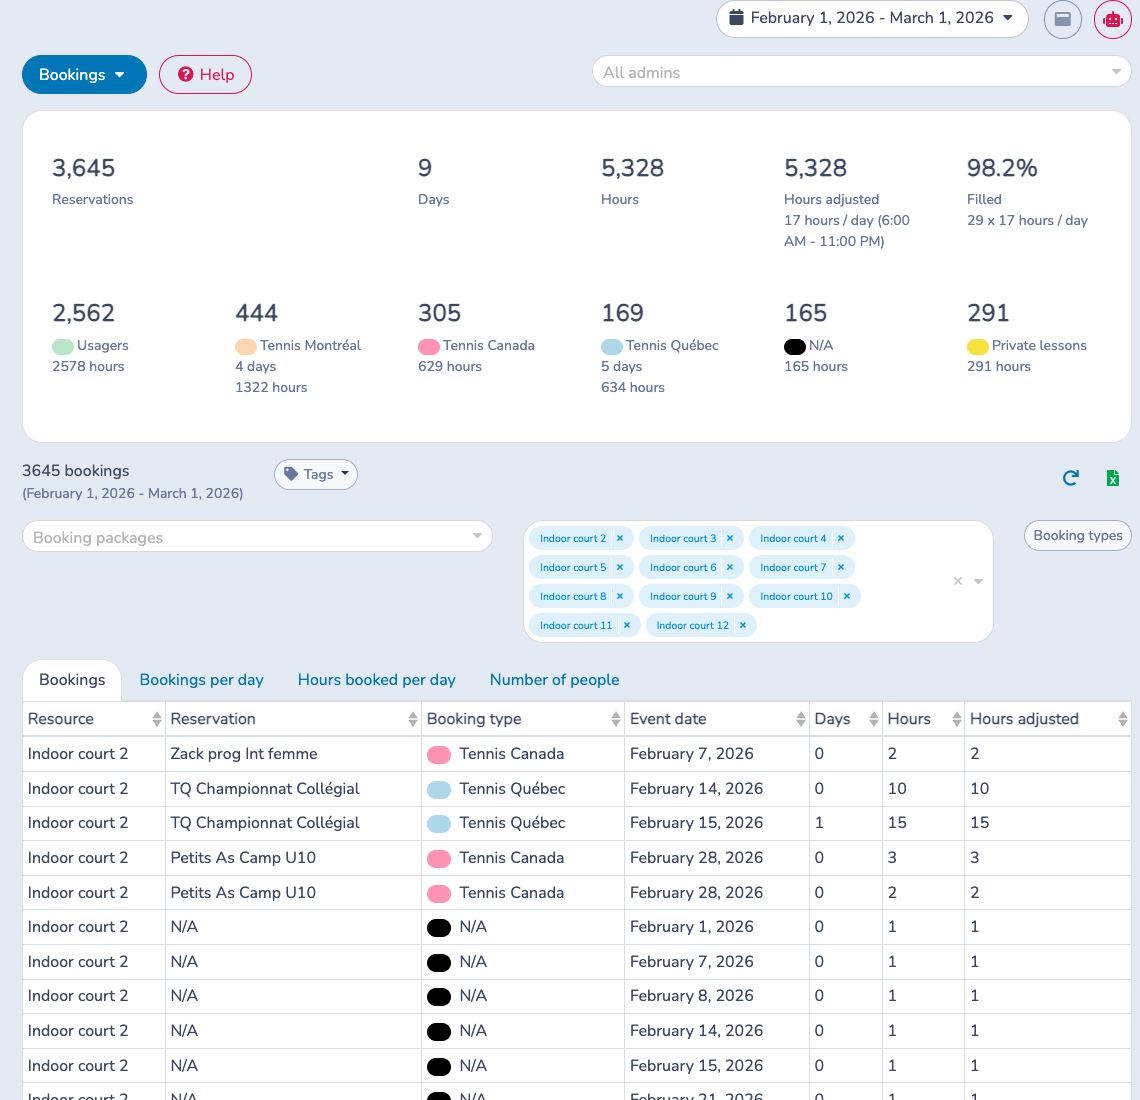
Select one or more booking packages, resources, resource tags or booking types. Selecting packages automatically selects the resources used by those packages. A scheduled event is included when it overlaps the selected date range; time outside the range is clipped. Closures are excluded.
The summary shows:
- Bookings: scheduled resource-event rows. One booking can contribute several rows when it reserves several resources.
- Days and Hours: scheduled duration inside the selected range.
- Adjusted hours: duration limited to the organization’s configured daily opening window and never greater than the booking’s actual duration.
- Filled: adjusted hours divided by the selected resources, inclusive days and configured hours per day. This measures resource utilization, not paid occupancy, class capacity, attendance or distinct clients.
- Booking-type cards: the same rows grouped by type. Bookings without a type appear under None.
Use the four tabs for different detail:
- Bookings lists each resource event.
- Bookings per day counts resource-event rows by date and booking type.
- Hours booked per day divides overlapping hours by date and booking type.
- Number of people totals distinct recipients attached to eligible, non-cancelled booking invoice items. It does not count check-ins.
Excel exports all four views using the current dates, resources, packages and booking-type filters.
# Bookings revenue: finalized booking billing
Use Bookings revenue to review finalized invoice items attached to booking events. The selected range uses the scheduled event dates—not payment dates or the date the invoice was sold.
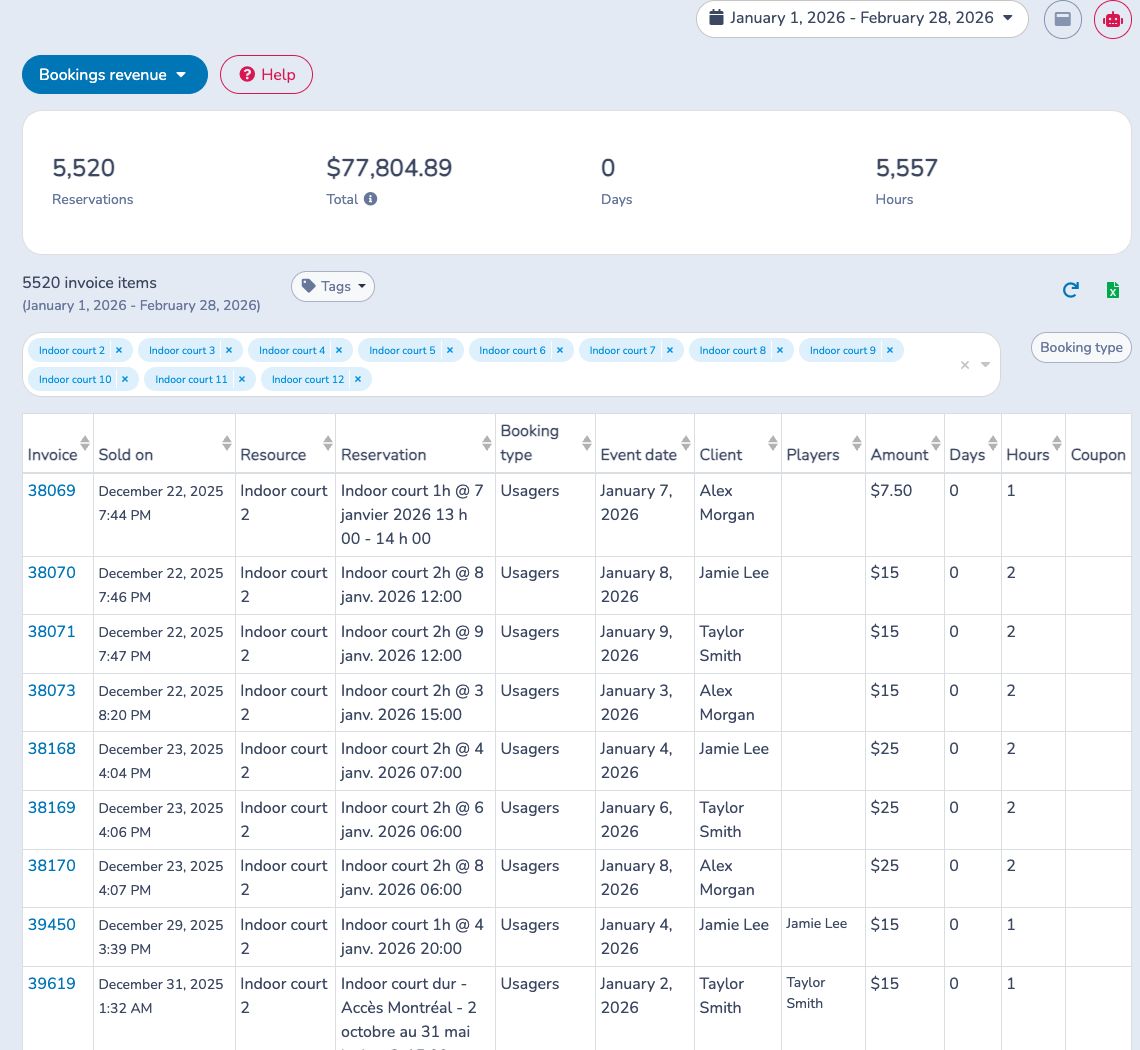
A row is included when its scheduled event overlaps the selected range, uses a selected resource and remains linked to an existing finalized invoice and invoice item. The invoice does not have to be paid. Each eligible invoice item appears once even when it has several related events or recipients.
- Total is item price × quantity before discounts and taxes. It is client billing, not cash received or recognized revenue.
- Days and Hours are the full scheduled event duration. Unlike the utilization report, they are not clipped to the selected range or adjusted to opening hours.
- Sold on is the invoice finalization time. Event date is the scheduled date used to select the row.
- Client, Players and Coupon provide the invoice recipient, available person answers stored for that recipient and generated-coupon detail.
Open an invoice number to verify payment status, discounts, taxes, cancellations and other details. Excel exports the complete filtered result; the on-screen page size does not limit the workbook.
# Traffic: recurring busy periods
Use Traffic to compare the average number of selected resources booked by weekday and time across the selected period.
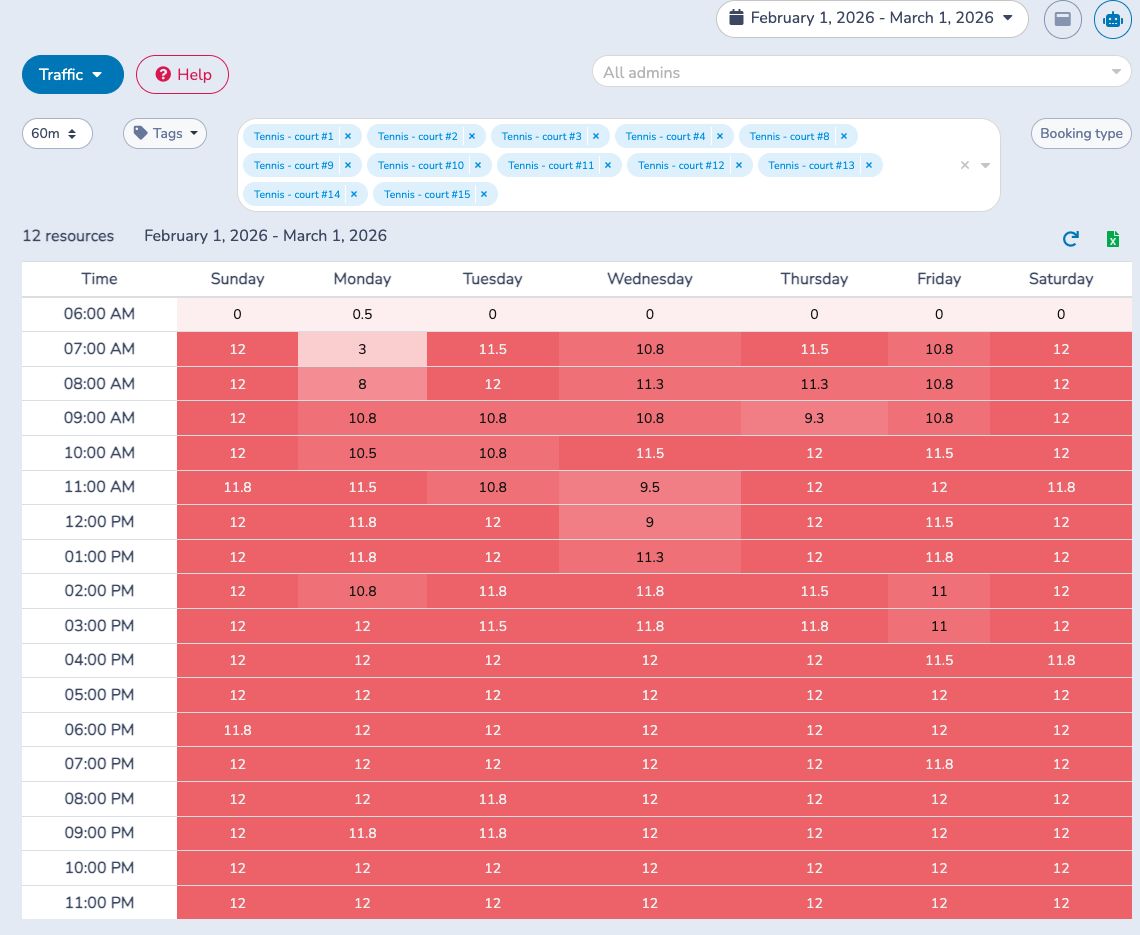
The report includes non-closure booking events that start in the date range. For each weekday and time bucket, it counts each selected resource at most once at the same exact date and time, then divides by the number of that weekday in the range. Decimal values are normal when several weeks are averaged.
Choose 60, 30, 20 or 15 minutes to sample longer bookings through the day. Booking starts are aligned to the hour before the interval buckets are built. Filter by resource tag, resources and one booking type.
The heat-map colors are relative to the highest value in the displayed result. A dark cell is busier than other cells in that grid; it does not necessarily mean that every selected resource was occupied.
# Live bookings: replay booking operations
Use Live bookings to investigate how booking carts and finalized invoices changed during one day, including possible conflicts for the same resource and start time.
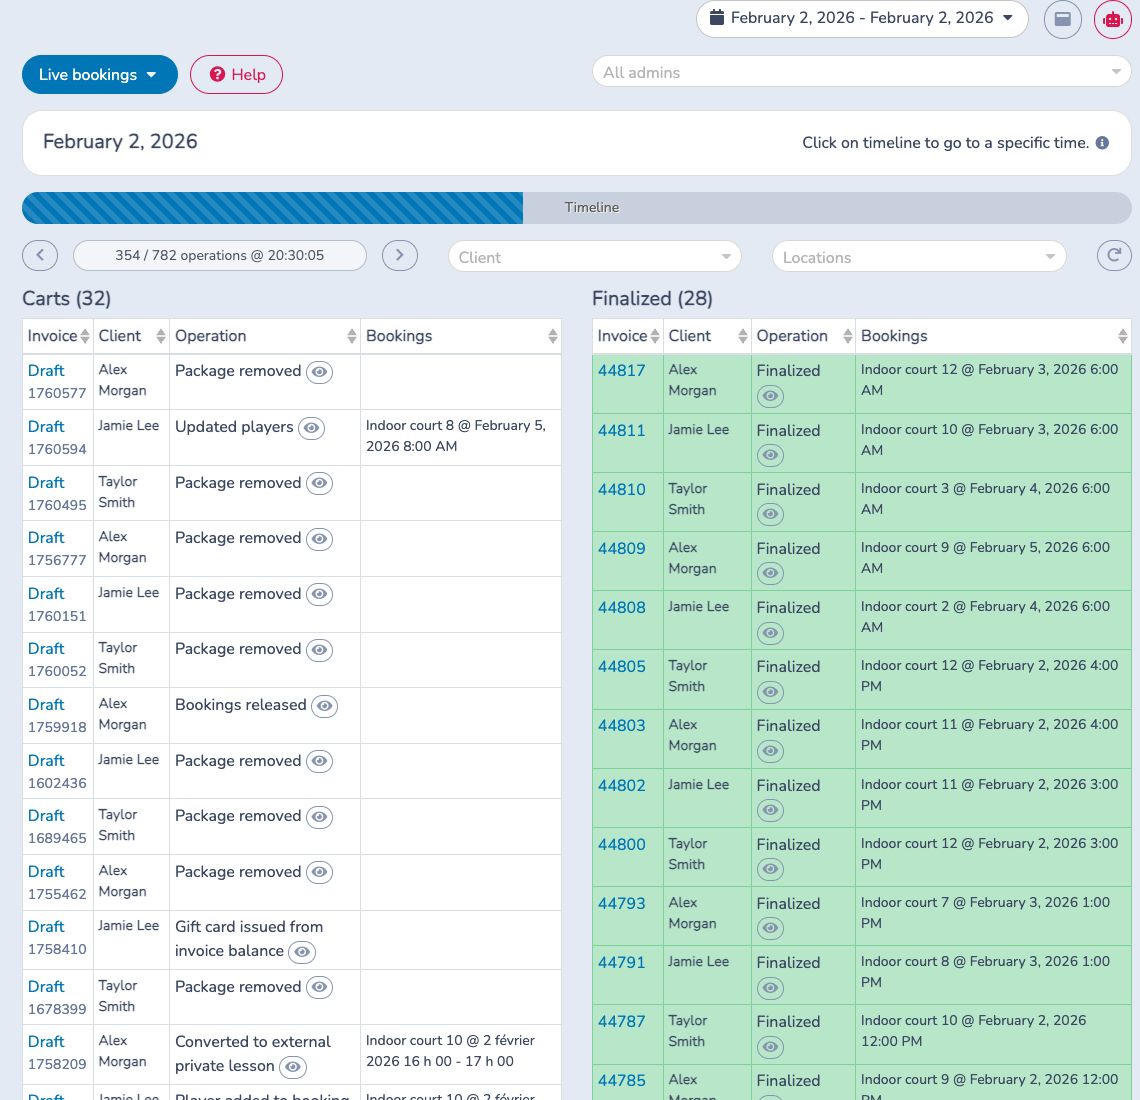
Only the first selected date is used. The report begins at midnight in the organization’s timezone and replays recorded invoice operations up to the selected point on the timeline.
- Click or drag on the timeline, or use the previous and next buttons.
- Filter by client or location when investigating a specific booking. The previous and next buttons skip operations outside the active filters.
- Review Carts for draft invoices and Finalized for invoices completed by the selected point. Cancelled booking rows can also appear in the finalized list.
- Select the eye button beside an operation to inspect that invoice’s history.
- Select a draft or invoice number to open the source invoice.
- Use Refresh to load operations recorded since the report was opened.
A Conflict badge means more than one displayed cart or finalized invoice claims the same resource and booking start time at the selected point. Red timeline marks identify moments when multiple add or update operations recorded the same resource and start time simultaneously. Treat these as diagnostic signals: inspect the affected histories and invoices to confirm the outcome.
Live bookings has no Excel export. Use Bookings for the resulting scheduled resource events and Bookings revenue for finalized billing.
# Choose the right report
- Start with Bookings for utilization, scheduled hours and daily volume.
- Start with Bookings revenue for finalized client billing tied to event dates.
- Start with Traffic for recurring weekday-and-time patterns.
- Start with Live bookings to reconstruct one day of cart operations and investigate possible conflicts.
- Use Sales for invoice-item sales and Payments for money received or refunded.